Where do our real trading cases and zone statistics come from?
The real cases are selected historical observations, not a performance record. The Price Action Trading Simulator development team publishes this method so readers can inspect the data behind our examples. The bank contains 220 educational cases; its 110 zone-touch labels describe market events under a particular rule, not a strategy win rate or evidence of future returns.
What can you inspect?
- Bank index and reported aggregate.
- Provenance and file checksums.
- Data format and publication notes.
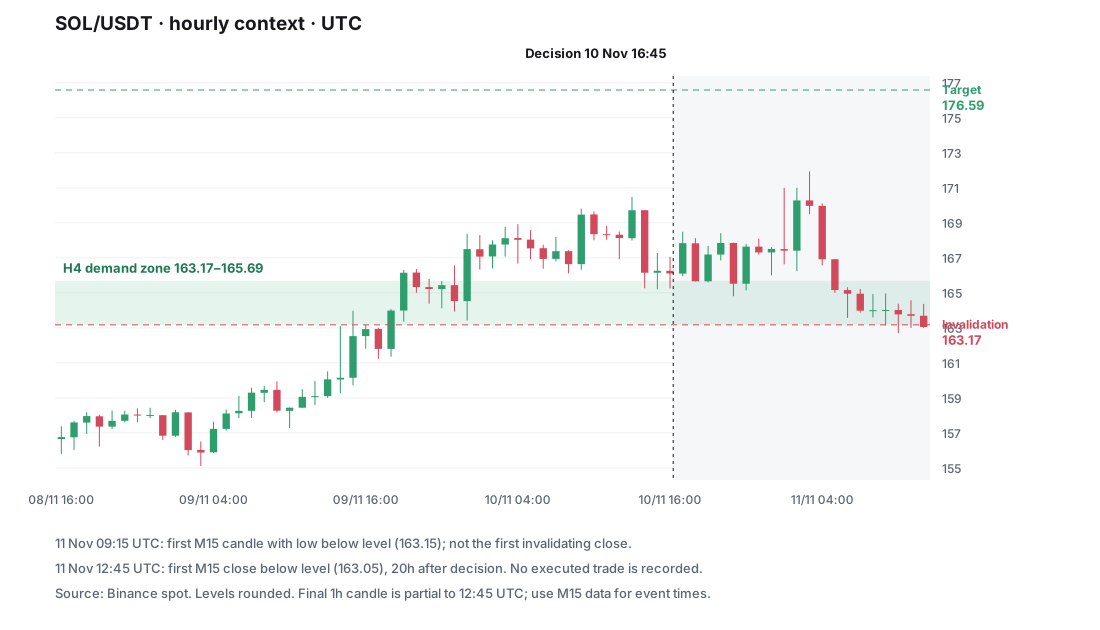
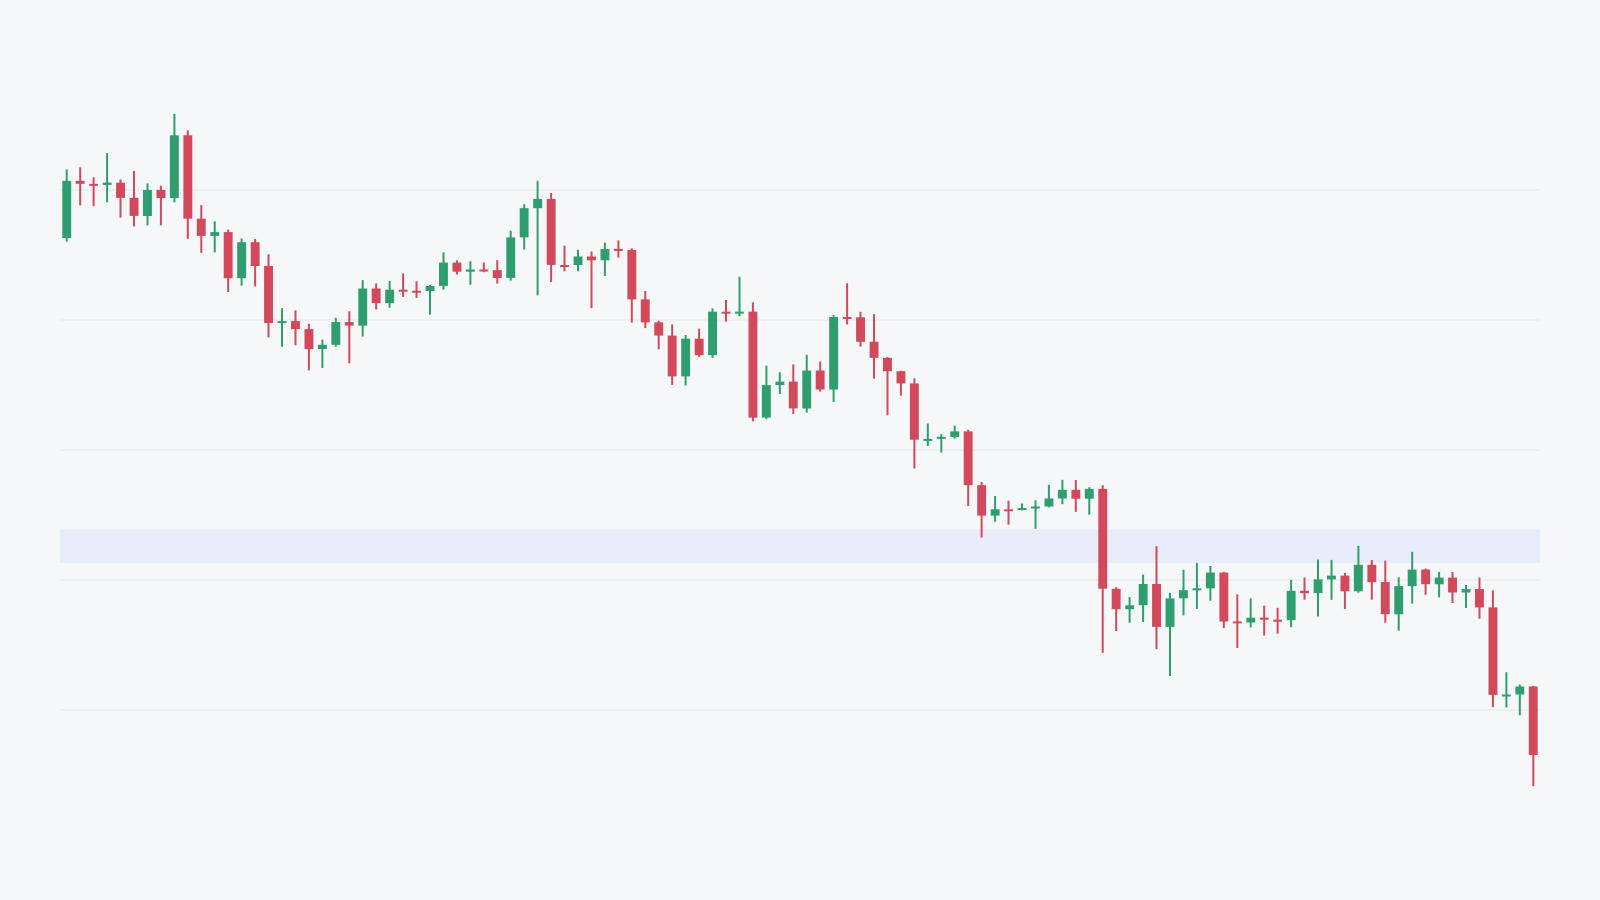
- SOL/USDT example with available candles.
Only five fixed-draw case files are public. They allow inspection of those examples, but do not independently reproduce all 110 touch outcomes. The aggregate is first-party metadata, not an independent audit.
Source, selection and scope
The source is Binance public spot klines for BTCUSDT, ETHUSDT and SOLUSDT. Binance documents the candle endpoint and fields. Our export uses schema 2, bank revision 2 and selection rule fresh-confirmed-source-touch-v1, generated on October 21, 2026.
The bank contains 110 touch, 29 approaching, 28 tight-range and 53 stand-aside cases. The five website examples use CaseDraw.seeded(bank, {}, seed) with seed 20261021, fixed before presenting their outcomes. This draw is from an already selected educational bank. It is not a random sample of every market touch, and the selected examples cannot establish market-wide probabilities.
The touch cases are dated October 19, 2024 at 22:45 UTC through October 2, 2026 at 18:45 UTC. BTC, ETH and SOL cases may reflect related market moves; do not assume each is an independent trial.
What do the labels count?
The rule scans subsequent M15 candles within the stored 72-hour horizon.
| Stored label | Event rule | Count | Share of 110 |
|---|---|---|---|
| targetFirst | Candle range reaches the target; a wick counts | 25 | 22.7% |
| invalidatedFirst | M15 close strictly beyond the invalidation level | 74 | 67.3% |
| unresolved | Neither resolving event recorded within the horizon | 11 | 10.0% |
For a buy scenario, invalidation is a close below the level; for a sell, a close above. If target and invalidation qualify in the same candle, the implementation assigns invalidation conservatively. It does not establish the intrabar event order. Unresolved cases remain in the denominator; they are not silently removed as inconvenient results.
These counts contain no filled entry, stop order, position size, fees, spread or slippage. They do not compare touch entries with confirmation entries. They cannot establish that a confirmation rule improves returns, that a touch strategy loses, or that consecutive stop losses occurred.
SOL example: why −1R is not the stored outcome
The decision time is November 10, 2025 at 16:45 UTC. References are zone edge 165.6875, invalidation 163.1725 and target 176.5875. The chart rounds these levels for readability.
| Observation on November 11 | Candle open, UTC | Known at close, UTC | Price |
|---|---|---|---|
| First later low below invalidation | 09:15 | 09:30 | Low 163.15 |
| First later close below invalidation | 12:30 | 12:45 | Close 163.05 |
The second row sets the invalidatedFirst label, known 20 hours after the decision. OHLC data identifies the low within the earlier candle, not its exact tick time or an actual stop fill. In the JSON, each row is [openTimeUnixMs, open, high, low, close, volume]; candle time is its open. The knownAt field marks when the closing observation is available.
Use M15 candles and knownAt for the event timeline. The final aggregated H1 or H4 bar can be partial through knownAt; do not treat it as a completed higher-timeframe candle.
A simulated exact fill at a fixed stop can be defined as −1R before costs. Exiting after a close at 163.05 is a different rule and can lose more. Neither return is an executed trade recorded here. See stop-order versus close-based arithmetic.
What about gold and forex in backtesting?
They are separate from this BTC/ETH/SOL case bank. The app’s gold and forex backtest series use Yahoo Finance chart data. Gold is GC=F, a COMEX gold futures series displayed as XAU/USD in the app, not a spot XAU/USD feed. Instrument prices, contract specifications and execution should not be treated as interchangeable; CME documents its gold futures contract.
What is the appropriate next step?
Use these cases to practise describing a decision before seeing more candles. To assess a trading rule, define entries and exits, include costs, preserve untouched test data and examine uncertainty. Does price action work? lays out that separate question. This method documents first-party educational content; it does not validate a trading edge.
Frequently asked questions
Where do the real cases come from?
Our educational case bank contains 220 selected BTCUSDT, ETHUSDT and SOLUSDT cases from Binance spot history. Website examples use a fixed draw with seed 20261021. The public export contains five cases and bank-level aggregate metadata.
Is the 110-touch statistic a strategy win rate?
No. It counts stored zone outcomes within 72 hours: 25 targetFirst, 74 invalidatedFirst and 11 unresolved. It includes no executed entries, position sizes, transaction costs or broker fills.
Can I reproduce all 110 outcomes from the public files?
No. Only five fixed-draw case files are published. You can inspect those observations and the reported aggregate, but the five files cannot independently reproduce the entire 110-case count.
Why is a zone invalidation different from a stop loss?
Our invalidation label uses an M15 close beyond the level. A fixed stop could trigger earlier during a candle. The SOL example has a first low crossing at 09:15 UTC and a first qualifying close at 12:45 UTC on November 11, 2025.
Written by the app’s development team. See the data, selection rules and limits of these first-party examples. Sources & method →
Keep reading
-
Does price action work? How to assess a trading rule
Price action names a broad approach, not a proven edge. Learn how to define one rule, avoid hindsight and test net results on untouched data.
-
Where should I place my stop loss? A price action guide
Choose an exit rule before sizing a trade. A fixed stop and a candle-close invalidation are different; a real SOL timeline shows why fills matter.
-
Can a 40% win rate at 2R make money after trading costs?
At 40% wins and 2R payoff, gross expectancy is 0.2R per trade. Calculate how fees, spread, slippage and variable exits change break-even.