Can a 40% win rate at 2R make money after trading costs?
Yes in a simplified model; a 40% win rate with +2R winners and −1R losers averages +0.2R before costs. It is positive after costs only if the assumed average all-in cost is below 0.2R per trade. Neither the win rate nor the target ratio alone establishes a profitable strategy.
Calculate a complete hypothetical batch
Assume 100 trades, fixed initial cash risk of 10 USD per trade, 40 wins at +2R and 60 losses at −1R. This is invented arithmetic, not an app result or forecast.
- Gross wins: 40 × 2R = +80R.
- Gross losses: 60 × −1R = −60R.
- Gross total: +20R, or 200 USD under the fixed-risk assumption.
| All-in assumed cost per trade | Cost for 100 trades | Net total |
|---|---|---|
| 0R | 0R | +20R |
| 0.1R | 10R | +10R |
| 0.2R | 20R | 0R |
| 0.3R | 30R | −10R |
At 10 USD initial risk, 0.1R is 1 USD. The cost figure must include the effects you are subtracting—such as round-trip fees, spread and slippage—without counting an effect twice if the recorded fill already includes it. Holding or financing costs depend on the instrument and trade duration.
What is the formula?
Let p be win probability, b be the winner in R, and c be cost in R on every trade. Assume every gross loser is exactly −1R:
Expected net R = p × b − (1 − p) − c.
Set it to zero and solve: p = (1 + c) ÷ (b + 1). With b = 2 and c = 0.1, p = 1.1 ÷ 3 ≈ 36.7%. Before costs, the same model breaks even at 33.3%.
This formula changes if losses, costs or payoffs vary. A more general calculation is p × average gross winner − (1 − p) × average gross loss magnitude − average cost. If journaled returns are already net, average those returns directly.
Why can a 2R target still disappoint?
A planned target is a price reference. Some positions may exit early, lose more than 1R, have partial fills or remain unresolved. Calculate the realised average rather than assuming every winner reaches 2R. Also inspect drawdown and clusters of related trades: positive sample average is not a promise about the next sequence.
Our 25 targetFirst labels out of 110 selected touches cannot be inserted as a strategy win rate. They are zone events without execution; the methodology explains why.
A useful self-check
Before trusting a result, write: “Are my returns gross or net? Is 2R a target or the average achieved? Are skips and unresolved positions handled consistently? How many rule versions did I try?” Use the journal guide to preserve those answers.
Price Action Trading Simulator lets you choose a simulated fee in R in manual backtesting. Setup is free to inspect; starting a session needs Pro. Its historical replay does not reproduce actual broker costs or fills. For testing quality beyond this arithmetic, read does price action work?.
Frequently asked questions
Can a 40% win rate be profitable at 2R?
Under the simplified model of every win +2R and every loss −1R, gross expectancy is 0.4 × 2 − 0.6 × 1 = +0.2R per trade. It is positive net only if average costs are below 0.2R under those assumptions.
What is break-even win rate after costs?
With a fixed +bR winner, −1R loser and cost cR on every trade, p = (1 + c) ÷ (b + 1). At b = 2 and c = 0.1, break-even is about 36.7%.
Can I use the target ratio as my average win?
Only if actual exits match that target under the model. Partial exits, early closes and slippage change the realised average. Use net journaled returns without subtracting the same costs twice.
Written by the app’s development team. See the data, selection rules and limits of these first-party examples. Sources & method →
Keep reading
-
What Is Risk-Reward Ratio? The Win Rate You Need to Break Even
R:R compares planned risk and reward. With fixed +2R wins and −1R losses, break-even is 33.3% before costs. Examples show why targets are not realised payoffs.
-
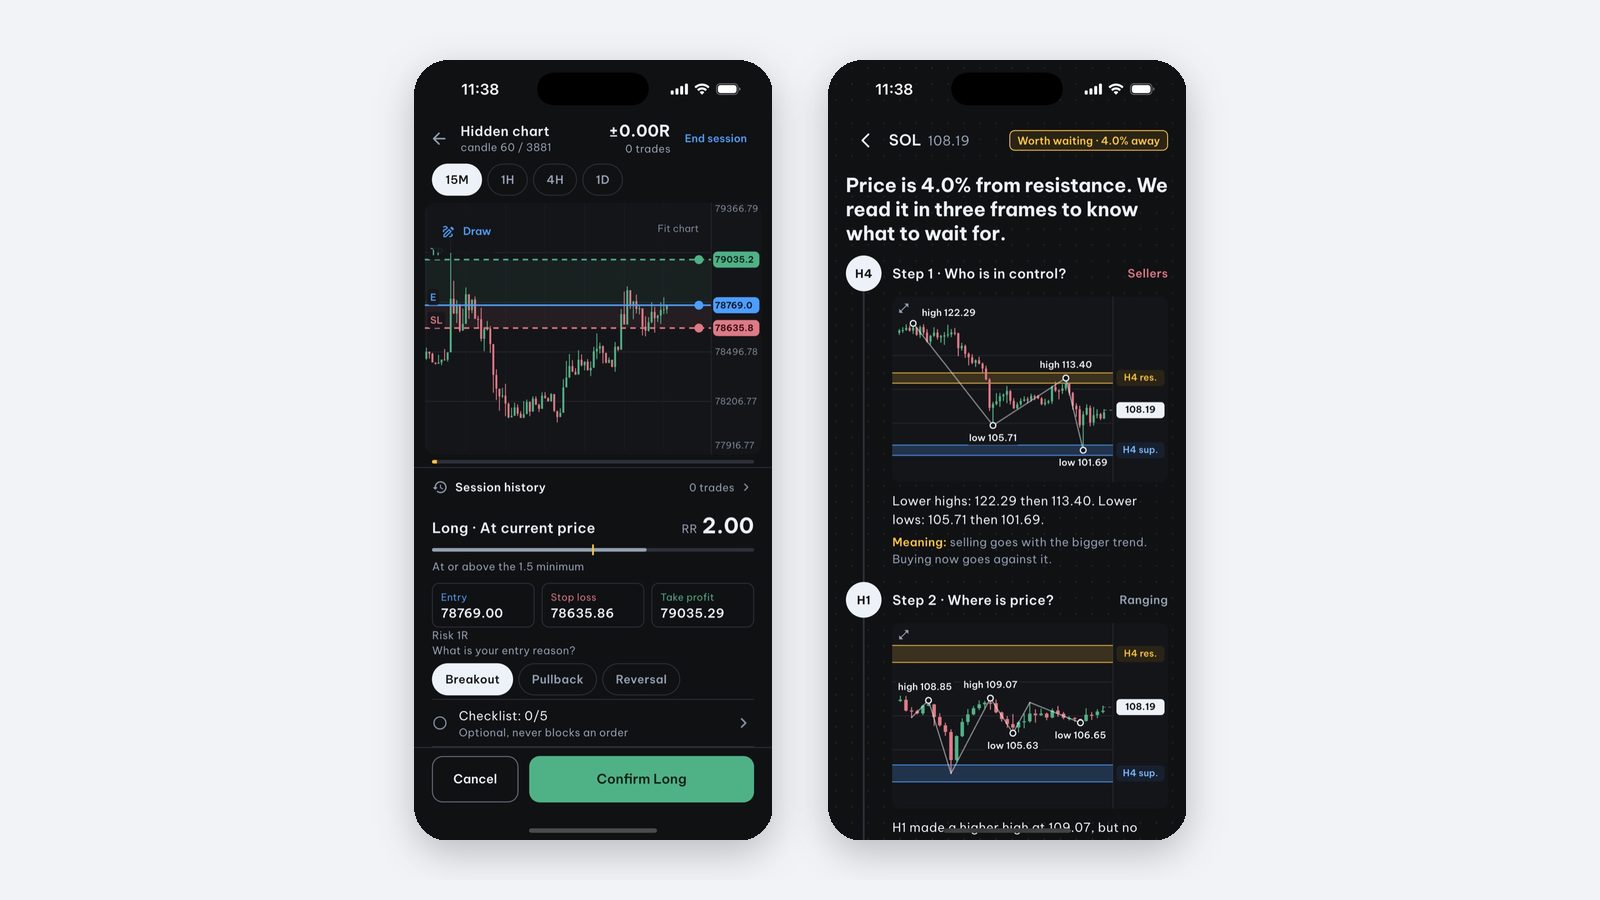
How do I calculate position size from my stop loss? Worked examples
Size a linear position from a chosen risk budget, stop distance and unit value. Examples state fill, cost, contract and currency assumptions explicitly.
-
Does price action work? How to assess a trading rule
Price action names a broad approach, not a proven edge. Learn how to define one rule, avoid hindsight and test net results on untouched data.