Does price action work? How to assess a trading rule
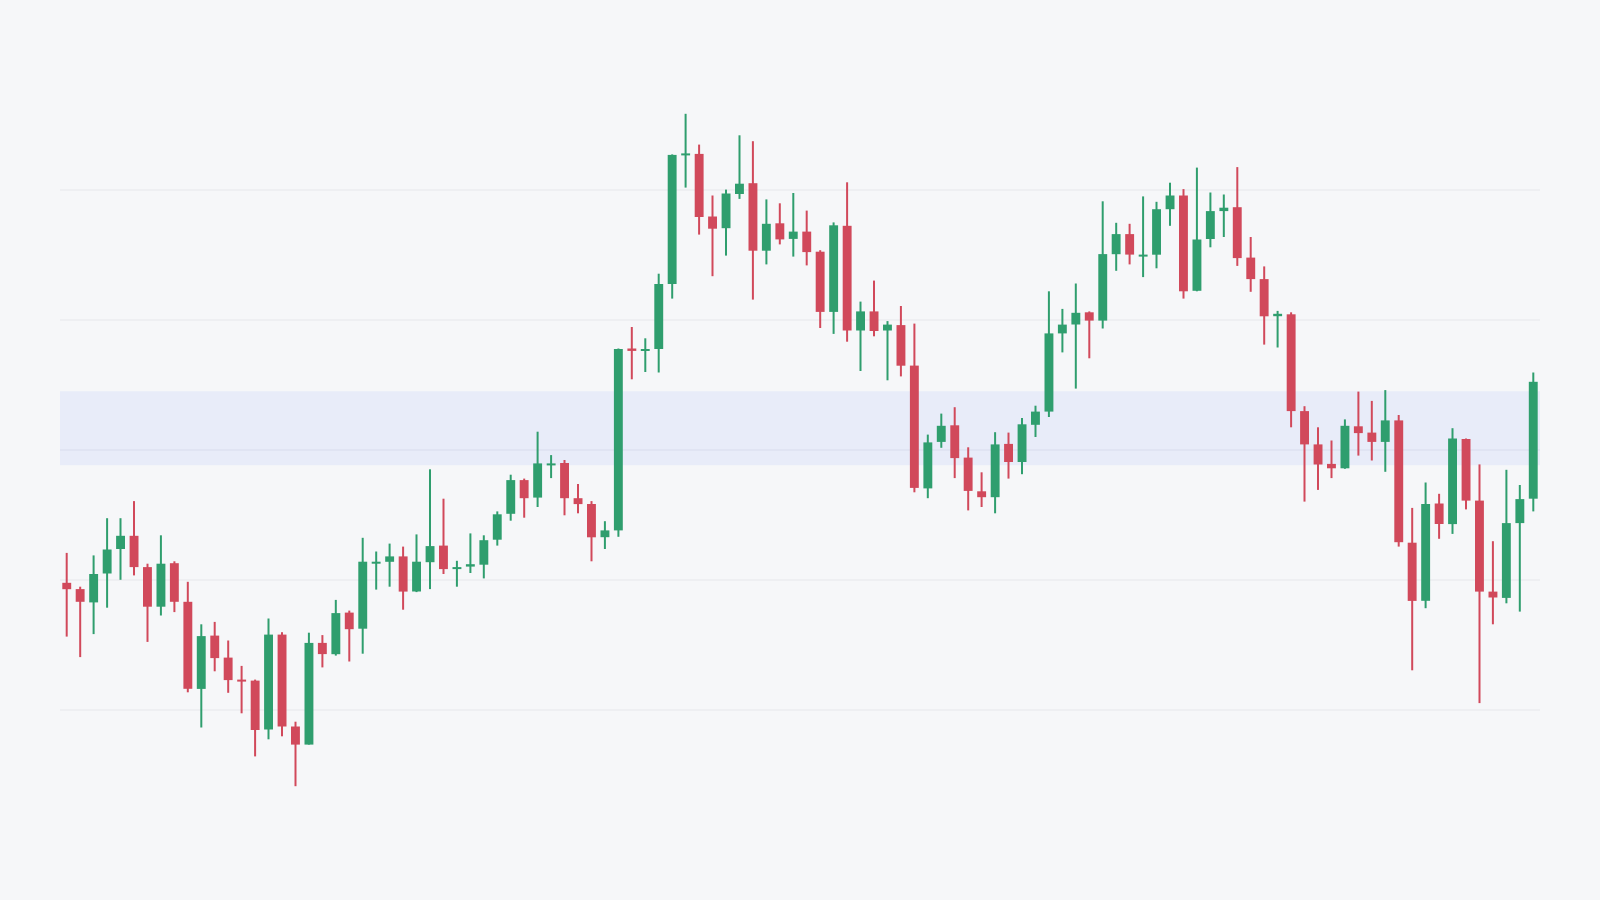
“Price action” is too broad to prove or disprove as one strategy. It can mean many different ways of reading candles, structure and levels. The testable question is: does a specific rule, defined before the outcome, show a positive net result on data that did not help create it? This website does not establish such an edge.
Turn a chart opinion into a rule
“Buy strong support” is not reproducible. A test needs the market and timeframe, how support is identified using information available then, an entry trigger, exit rule, position calculation, costs and conditions for skipping. Write how to handle gaps, missing candles and a candle that contains both stop and target.
Two readers should be able to identify the same eligible decisions. If they cannot, first test the clarity of the definition. Knowing patterns but not when to enter gives a decision exercise for that stage.
A test record should answer these questions
| Question | Evidence to keep |
|---|---|
| Did I select a favourable period? | The starting rule and all eligible periods |
| Did I change rules after losses? | Every version and every parameter tried |
| Did future information leak in? | Data available at each decision, including higher-timeframe closes |
| Does the result survive costs? | Net returns under stated fill, spread and fee assumptions |
| Does it hold outside development data? | Untouched later periods or a predeclared holdout |
| How uncertain is the result? | Sample size, dispersion, drawdowns and clustered exposures |
A larger sample does not fix future leakage or cherry-picking. If you keep consulting the holdout and changing the rule, it becomes development data too.
A profitable-looking sample is not enough
Hypothetical arithmetic: 10 trades, each winner +2R and each loser −1R. Four wins and six losses produce 4 × 2 − 6 = +2R gross. If the assumed total cost is 0.25R per trade, the cost is 2.5R and net result is −0.5R.
Even a positive net result would describe that sample, not guarantee an underlying edge. The win-rate and costs guide explains the assumptions. The simulation limitations identified in 17 CFR 4.41, including hindsight and nonexecution, are reasons to keep hypothetical results distinct from live records.
What can our cases establish?
Our 110 touch labels describe a selected BTC/ETH/SOL educational bank. They include neither filled entries nor a tested entry rule. They do not establish that confirmation improves returns or supply a strategy win rate. Inspect the methodology and public-data limits.
What should I do next?
If you cannot yet define a rule, practise stating decisions with the future hidden. If the rule is already precise, log all eligible trades, preserve a holdout and evaluate the assumptions before optimising it.
Price Action Trading Simulator supports the first task and manual historical replay on iPhone and iPad. It does not run coded tests across many symbols or reproduce broker fills. One five-case session is free; backtest starts need Pro. For the difference between a replay result and live execution, read profitable backtest, losing live.
Frequently asked questions
Does price action work?
The label is too broad for a single win rate or yes/no answer. Assess a specific, frozen entry and exit rule on appropriate data with costs and uncertainty. This website does not establish a profitable price action strategy.
Does recognising candlestick patterns prove an edge?
No. Recognising a shape after the outcome and trading a checkable rule before the outcome are different tasks. A rule needs a defined trigger, exit, size, costs and an honest test.
Do the app’s real-case statistics prove price action works?
No. They are selected zone observations with no executed trades or strategy comparison. They support practice examples, not a strategy performance claim.
Written by the app’s development team. See the data, selection rules and limits of these first-party examples. Sources & method →
Keep reading
-
Why is my backtest profitable but live trading loses?
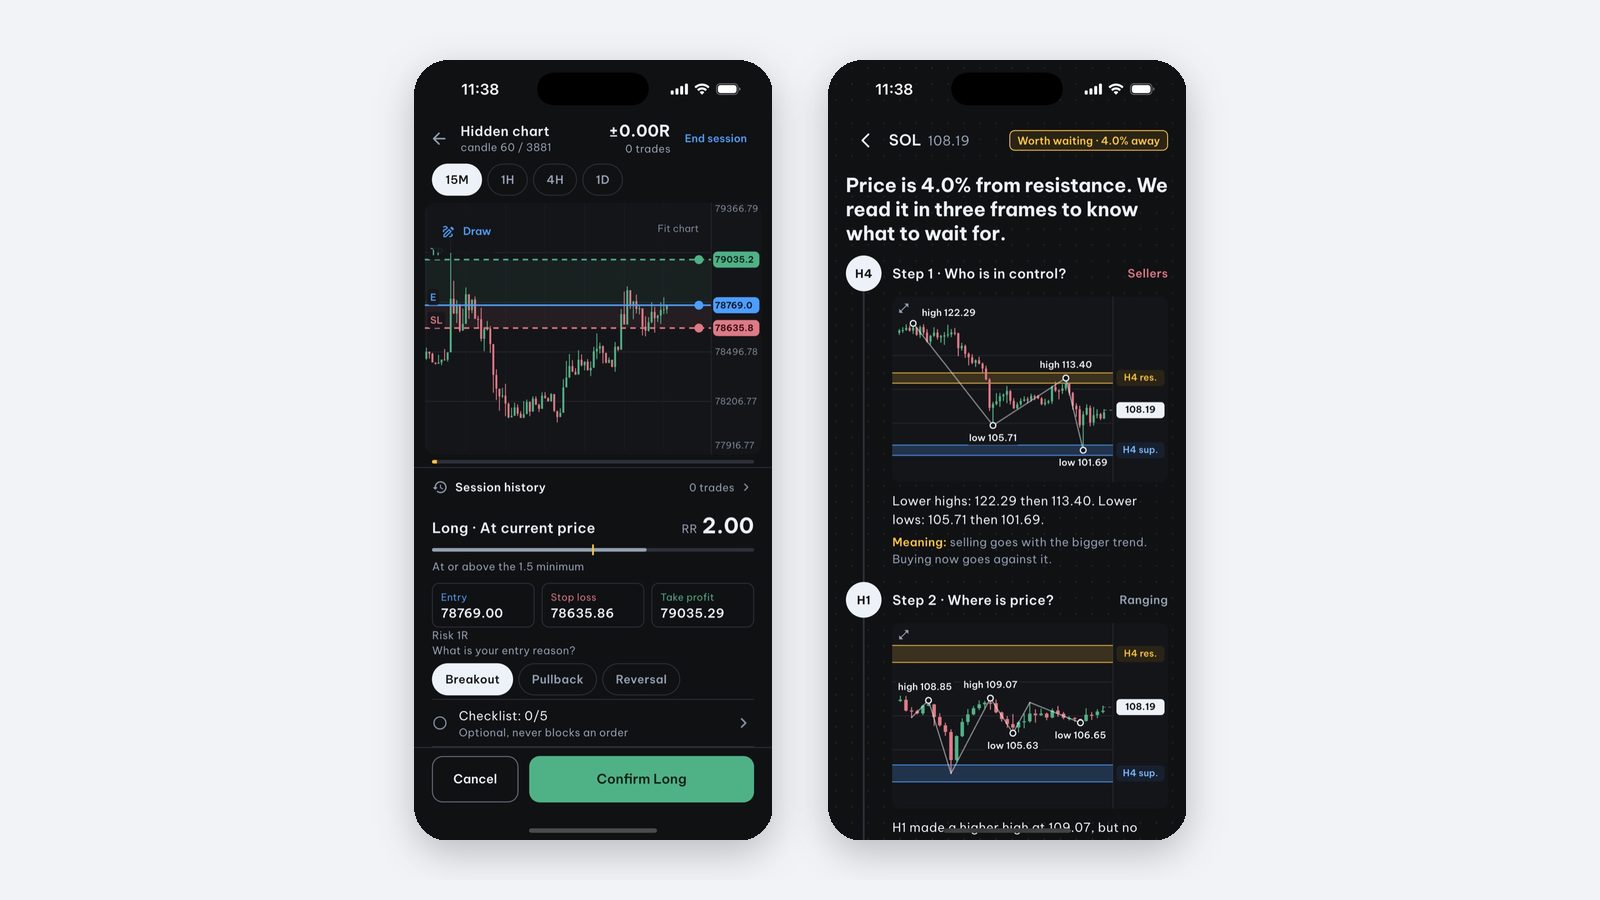
Audit the backtest-to-live gap: costs, fills, future leakage, rule changes and market exposure. Use a matched decision record before blaming psychology.
-
Can a 40% win rate at 2R make money after trading costs?
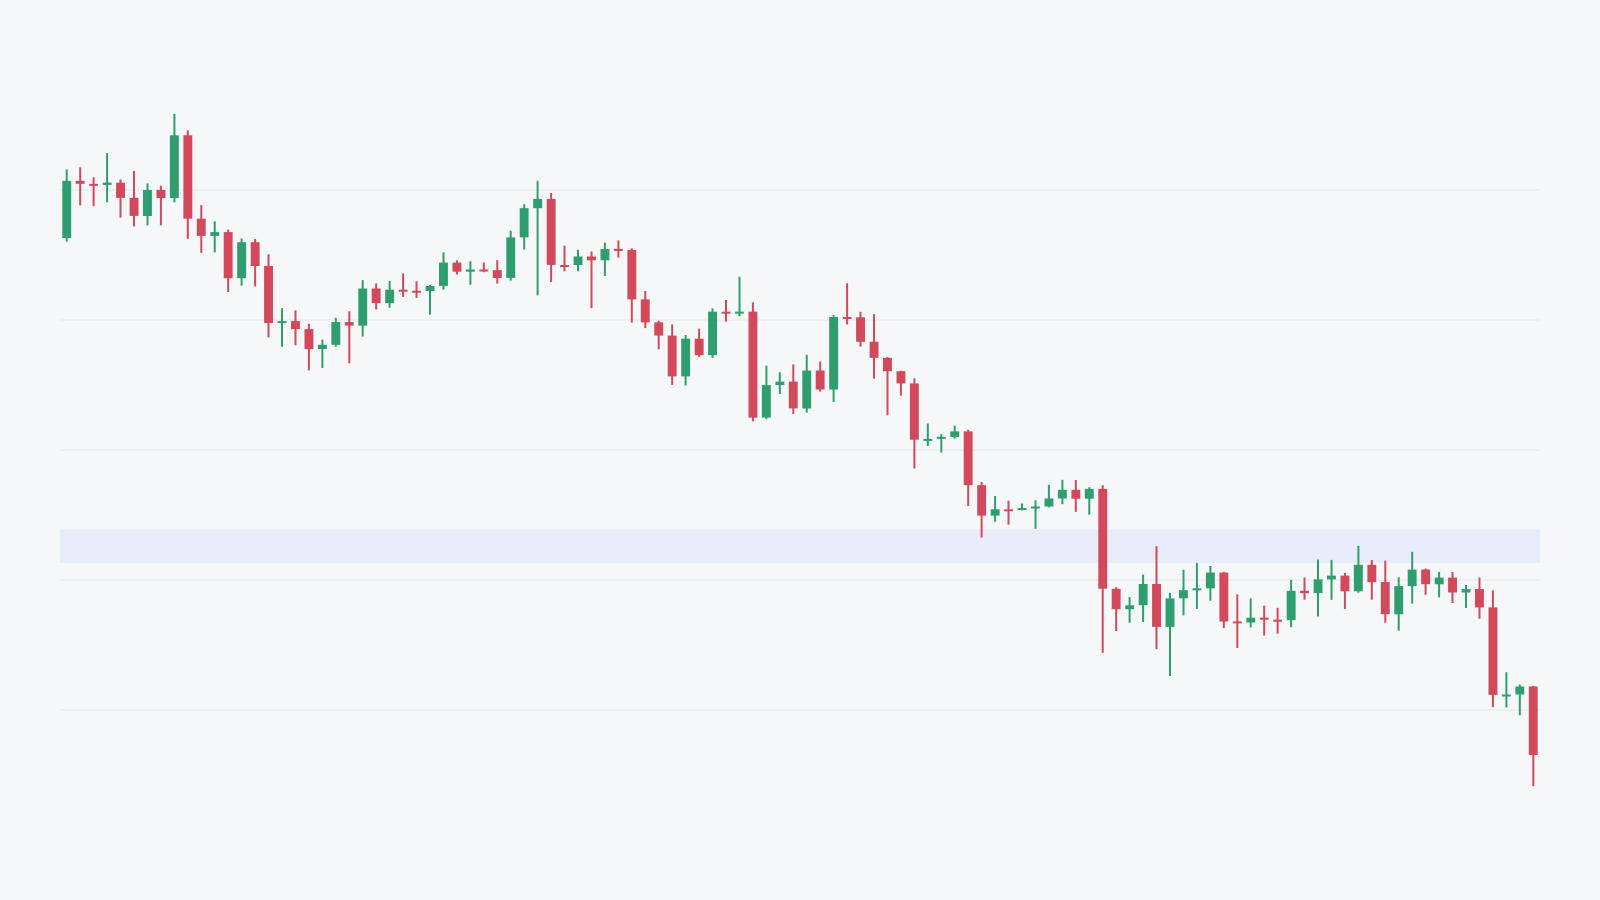
At 40% wins and 2R payoff, gross expectancy is 0.2R per trade. Calculate how fees, spread, slippage and variable exits change break-even.
-
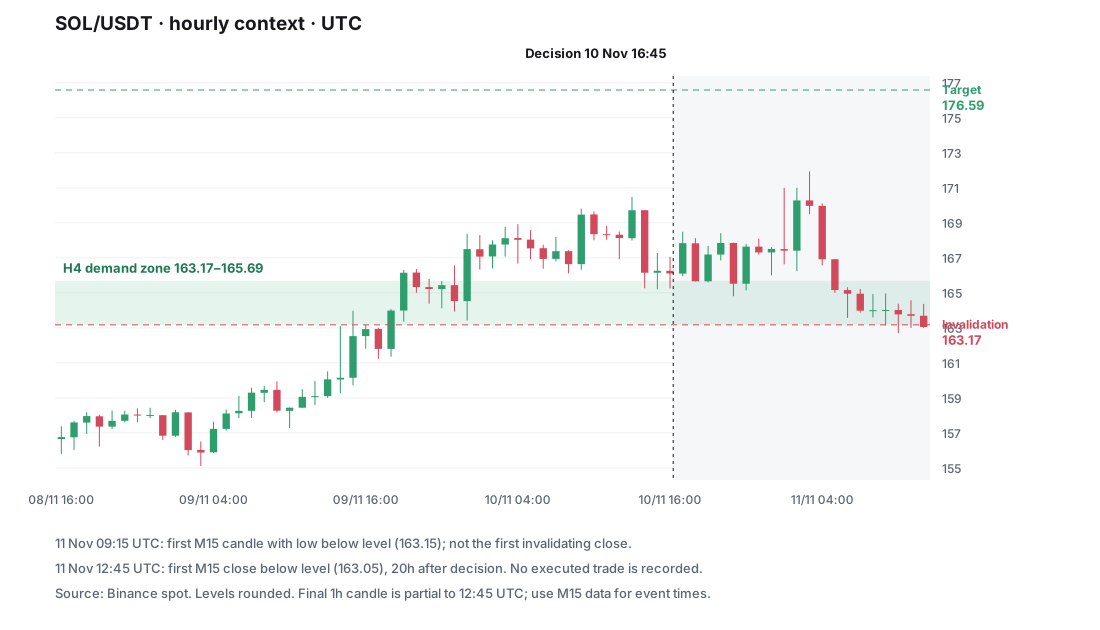
Where do our real trading cases and zone statistics come from?
How our selected Binance cases, fixed draw and 72-hour labels work. Inspect the SOL timeline, public files and limits of the 110-touch aggregate.