Why is my backtest profitable but live trading loses?
A profitable backtest and live losses can come from several different gaps. Check data, fills, costs, rule changes and market exposure before concluding that the problem is psychology. A historical result is a result under assumptions; it is not a promise that actual trading will match it.
Audit these gaps one at a time
| Possible gap | What to inspect |
|---|---|
| Future leakage | Was a higher-timeframe candle or later level visible before it existed? |
| Selection and overfitting | Were losing periods skipped or many versions tried before keeping one? |
| Execution | Were entries assumed filled at touched prices, with no spread or delay? |
| Costs | Were commissions, spread, slippage and applicable holding costs included consistently? |
| Rule differences | Did entry, exit, sizing or trading hours change? |
| Exposure and conditions | Did the live period contain different volatility, trends or clustered positions? |
A simulator is limited by its execution model. The discussion of hypothetical results in 17 CFR 4.41 highlights hindsight and missing execution effects.
How can costs reverse a result?
Hypothetical example: 100 decisions with an average gross result of +0.15R. Gross total = 100 × 0.15 = +15R. If combined execution and transaction costs average 0.20R per trade, costs = 20R and net total = −5R.
This is arithmetic with assumed costs, not a measured strategy. Costs expressed in R change with stop distance: the same 1 USD cost is 0.1R when planned risk is 10 USD, but 0.5R when it is 2 USD. Win rate, reward and costs gives a fuller calculation.
A touched stop is different from a candle-close exit
Our SOL case records a first later low below 163.1725 in the M15 candle opening at 09:15 UTC on November 11, 2025. The first close below is 163.05 at 12:45 UTC. Calling both “exit at invalidation” conceals different rules. Neither observation records a fill. See the case methodology and stop guide.
Build a matched decision record
For each eligible setup, keep the rule version, timestamp, visible information, intended order, actual or simulated entry and exit, costs and reason for any deviation. If the rule says to skip, record that too. Do not rewrite the backtest until it agrees with the live loss.
A useful first review asks: “Which rows differ because of costs? Which differ because I used a different rule? Which remain unexplained?” A small live sample alone cannot distinguish random variation from a changed market or a weak rule. Preserve later data for another test and document changes as new versions.
Where does the app help?
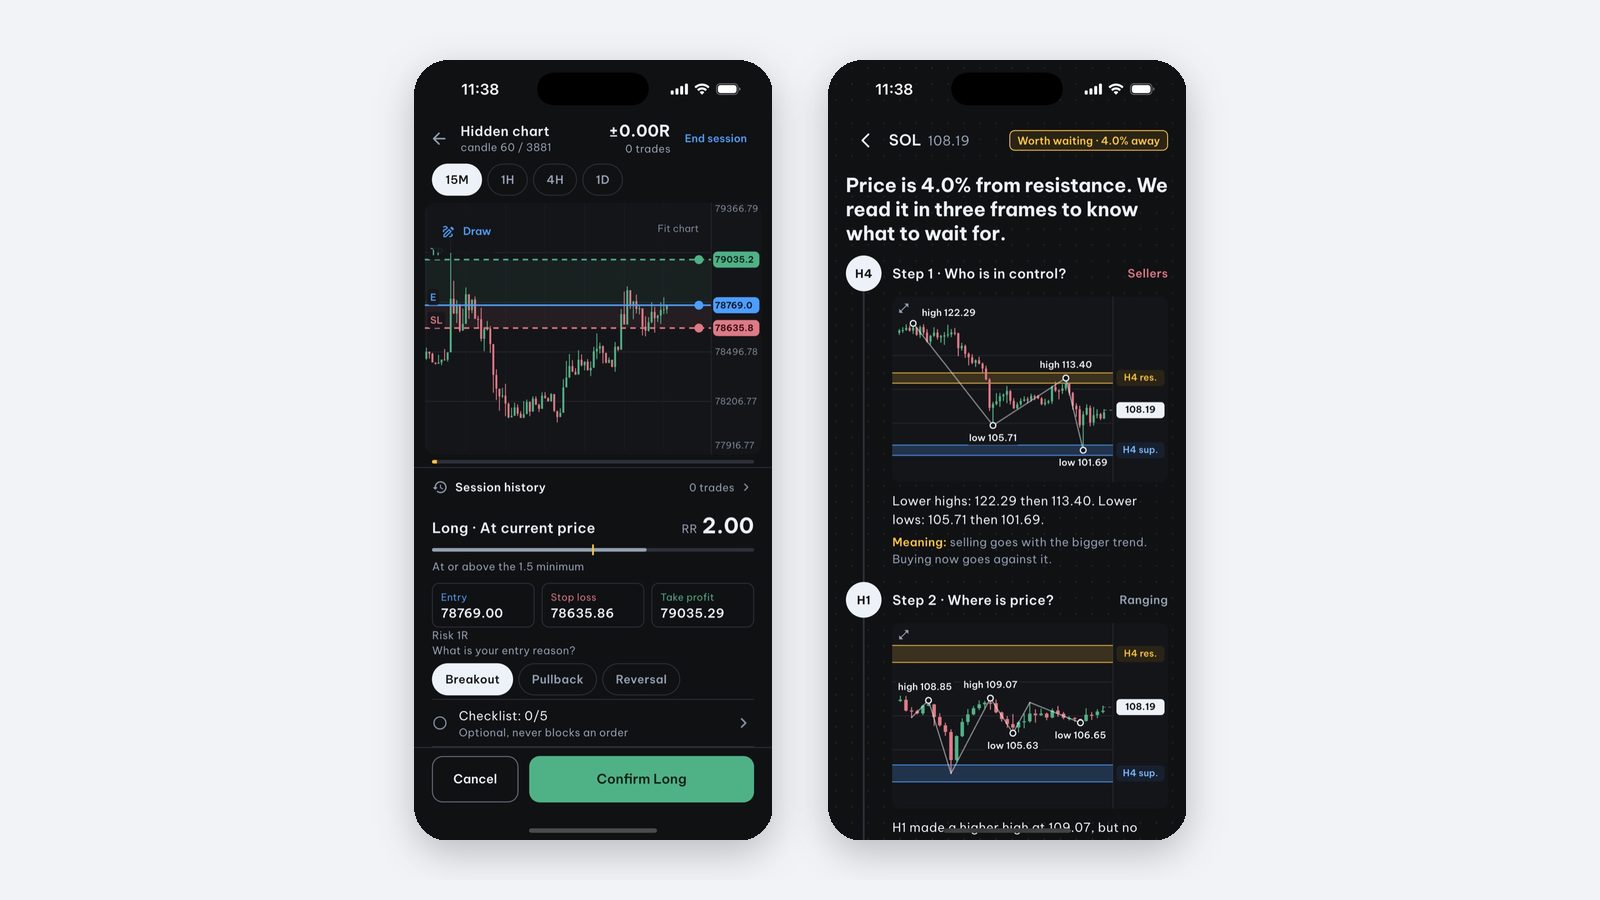
Price Action Trading Simulator supports manual historical replay, hidden dates, optional hidden symbols, saved sessions and a configurable simulated fee in R. It is for iPhone and iPad, with no real-money trading or broker connection. Setup is free to view; starting a backtest needs Pro. It does not import actual broker fills, export a trading journal or run automated validation.
Use it to rehearse a clear process, then evaluate its limits in your journal. A short profitable replay cannot certify an edge or readiness for live risk.
Frequently asked questions
Why can a profitable backtest lose live?
Possible gaps include costs, optimistic fills, future leakage, selected periods, changing market conditions and different decisions. Compare records before attributing the result to one cause.
Does a live loss prove the strategy stopped working?
No. A short sample can differ even under the same process. First check whether rules, execution assumptions, markets and costs match; then assess uncertainty and evidence for the rule.
How do I compare a backtest with live decisions?
Keep a frozen rule version and record decision time, information then available, planned and filled prices, size, costs and any deviation. Compare matched decisions rather than only account totals.
Written by the app’s development team. See the data, selection rules and limits of these first-party examples. Sources & method →
Keep reading
-
Can a 40% win rate at 2R make money after trading costs?
At 40% wins and 2R payoff, gross expectancy is 0.2R per trade. Calculate how fees, spread, slippage and variable exits change break-even.
-
How to manually backtest a trading strategy on iPhone (no code)
Step-by-step manual backtesting of forex, gold and crypto on iPhone: hide the future, log entry, stop loss and take profit in R, plus a journal template.
-
Trading journal: what to record and how to review mistakes
Record rules and planned risk before entry, then actual fills, costs and compliance. A journal separates execution mistakes from an untested strategy.