What Is Risk-Reward Ratio? The Win Rate You Need to Break Even
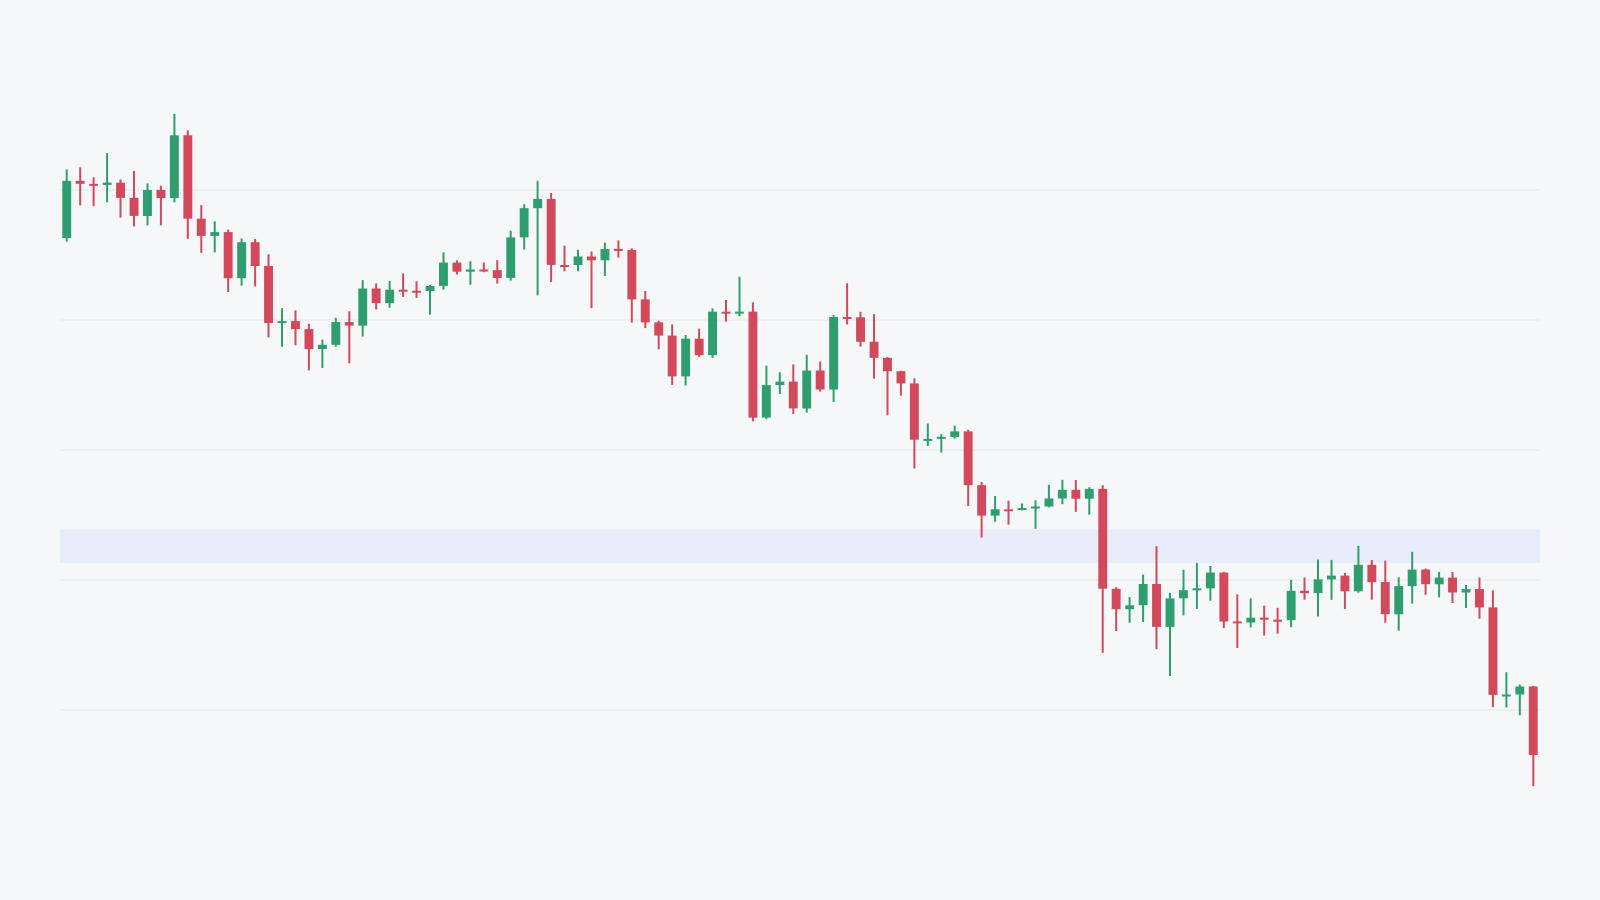
Risk-reward ratio (R:R) compares what you risk if a trade is wrong with what you can gain if it is right. A 1:2 trade risks 1 part to gain 2. The win rate you need to break even is 1 ÷ (1 + reward): at 1:1 you need to win 50% of trades, at 1:2 about 33%, at 1:3 25% (before fees). But a high R:R is not enough on its own: the farther the target, the less often price reaches it.
The break-even formula assumes every winner earns the stated reward and every loser loses exactly 1R, with no costs. A target ratio is not automatically an achieved payoff. Costs and variable exits change the calculation.
What is risk-reward and how do you calculate it?
R:R is the distance from entry to stop loss (the risk) compared with the distance from entry to take profit (the reward). The risk on one trade is commonly called 1R, so wins and losses can be measured in multiples of R.
Hypothetical example, exact fills and no costs: you buy at 100, with a stop loss (the planned exit trigger, not a guaranteed fill) at 95 and a take profit (the price where you lock in the gain) at 115.
- Risk: 100 − 95 = 5.
- Reward: 115 − 100 = 15.
- R:R = 5 : 15 = 1:3.
If your account is 1,000 USD and you risk 1% per trade (10 USD), the position size is 10 ÷ 5 = 2 units. An assumed exact stop fill loses 10 USD (−1R), and an exact target fill pays 30 USD (+3R), before costs. The full calculation is in how to calculate position size.
How does R:R relate to win rate?
They move together: the higher the R:R, the fewer trades you need to win to avoid losing money, and the reverse. Break-even is the win rate at which total gains equal total losses.
| R:R | Minimum win rate to break even | Wins needed out of 10 trades |
|---|---|---|
| 1:1 | 50% | 5 |
| 1:2 | 33% | 4 |
| 1:3 | 25% | 3 |
| 1:4 | 20% | 2 |
These numbers assume fixed target wins and exact −1R losses, ignoring trading fees and slippage. Fees push the modelled break-even higher, especially when the stop loss is small.
Example: 10 trades at 1:2, only 4 winners
Same 1,000 USD account, 10 USD risked per trade, R:R 1:2:
- 4 winners: 4 × 20 = +80 USD.
- 6 losers: 6 × 10 = −60 USD.
- Result: +20 USD, even though you lost more often than you won.
In R terms, the average trade is 0.4 × 2 − 0.6 × 1 = +0.2R. This is an illustration, not a result you should expect.
Why isn’t a high risk-reward ratio enough?
Because R:R only says how much bigger the reward is than the risk. It says nothing about whether price will reach the target. If you push take profit far away to make R:R look good, the win rate usually falls with it.
Take the same example at 1:3 with only 2 winners out of 10: 2 × 30 − 8 × 10 = −20 USD. A better-looking ratio, and still a loss, because 20% is below the 25% break-even.
Ways R:R looks good but isn’t real:
- A target outside any sensible level: nothing on the chart, such as resistance or structure, supports price getting there.
- A stop loss that is too tight: R:R goes up, but ordinary noise knocks you out. See where to place a stop loss.
- Forgetting fees: on small trades with narrow stops, fees take a larger share of 1R.
Our developer-maintained case bank contains 110 selected BTC, ETH and SOL zone-touch cases dated October 2024–October 2026. In its stored 72-hour observation window, 25 are labelled targetFirst, 74 invalidatedFirst and 11 unresolved. These are zone events, not executed trades or a strategy win rate. They do not test whether waiting for confirmation, chasing a move or a different stop improves returns. See the case-data methodology for selection, event rules and limits.
One stored example is SOL/USDT on November 10, 2025: zone edge 165.6875, invalidation 163.1725 and target 176.5875. The geometry gives (176.5875 − 165.6875) ÷ (165.6875 − 163.1725) ≈ 4.33R before costs. The zone later received an invalidatedFirst label, based on a close at 163.05. That is not a recorded −1R trade: the first low crossing the level happened earlier, and a fill depends on the exit rule. See the timeline and assumptions.
How do you set a realistic R:R?
Start from the chart, not from the number. A sensible order:
- Find the price that proves your idea wrong (put the stop loss just beyond it).
- Find the next reasonable target: a resistance zone, an old high or an old low.
- Calculate R:R from these two levels.
- If R:R is below the threshold in your plan, skip the trade. Don’t stretch the target to make it fit.
- Record the planned R:R and the actual result so you can tell whether your threshold makes sense.
That threshold belongs in a written trading plan, next to a fixed risk per trade. See risk management for beginner traders.
How can you practice R:R without real money?
One way to practise R:R is to place entry, stop and target, check the geometry, then compare assumed fills with later candles. Price Action Trading Simulator (iPhone and iPad) lets you do this on historical data:
- Manual backtest: reveal historical candles one by one, place entry, stop loss and take profit on the chart; a simulated fee per trade is counted in R; sessions are saved so you can review your decisions. The setup screen is free to browse; starting a session needs Pro.
- Entry drills: place entry, stop loss and take profit and get graded (Pro).
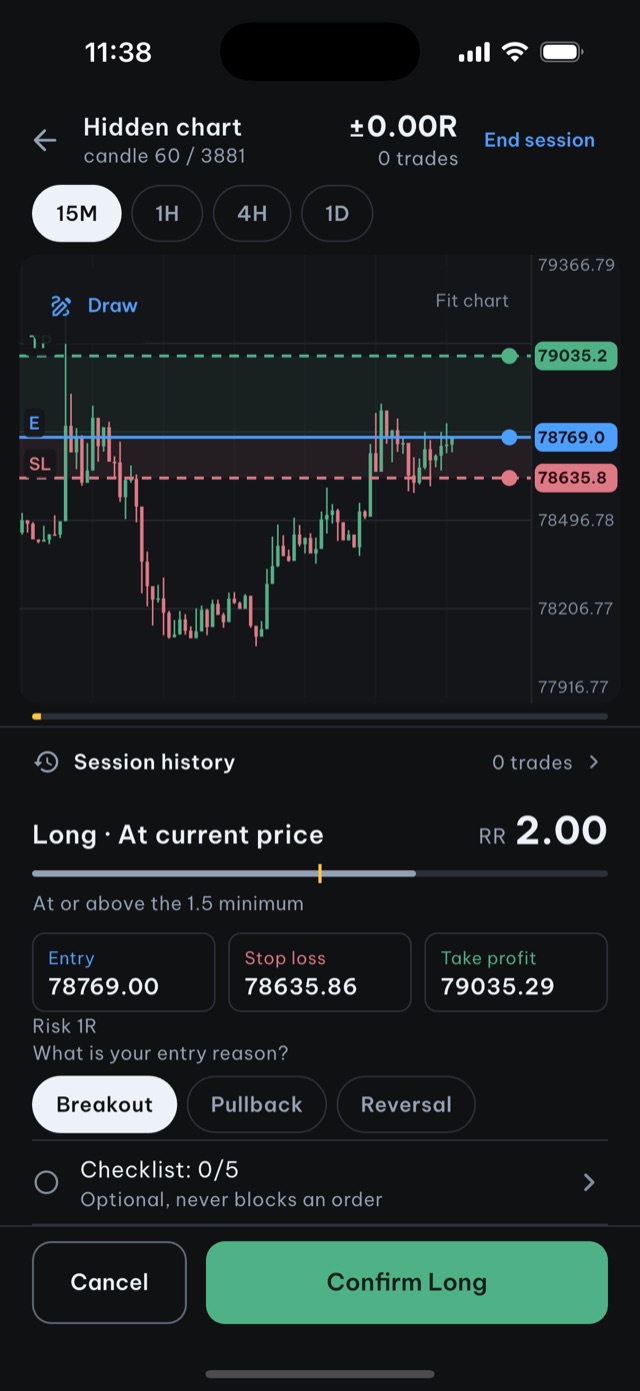
The app has no real-money trading, no broker connection and no account; progress stays on your device.
Source and scope: this is educational material by the Price Action Trading Simulator development team. Price/account examples are hypothetical unless identified as a historical observation; exact fills and omitted costs are assumptions, not guarantees. Our case-data methodology explains the historical sources, selection and limits.
Frequently asked questions
What is risk-reward ratio in trading?
Risk-reward (R:R) compares planned loss at the stop with planned gain at the target under stated fill assumptions. A 1:2 ratio means risking 1 part to gain 2 parts.
What win rate do I need to break even at 1:2 risk-reward?
About 33.3% before costs, assuming every winner is +2R and every loser −1R. With average cost cR on every trade, the same model breaks even at (1 + c) ÷ 3; actual variable exits require their realised averages.
Is a higher risk-reward ratio always better?
No. The farther the target, the less often price reaches it, so that target is not reached more often under the same entry, stop and observation window. R:R only helps when the target sits at a reasonable level on the chart and you still win often enough to clear break-even.
What minimum risk-reward ratio should I use?
There is no number that is right for everyone. Set a threshold in your plan (for example, skip trades below 1:2), then test it against historical data and your own trading journal.
Written by the app’s development team. See the data, selection rules and limits of these first-party examples. Sources & method →
Keep reading
-
Can a 40% win rate at 2R make money after trading costs?
At 40% wins and 2R payoff, gross expectancy is 0.2R per trade. Calculate how fees, spread, slippage and variable exits change break-even.
-
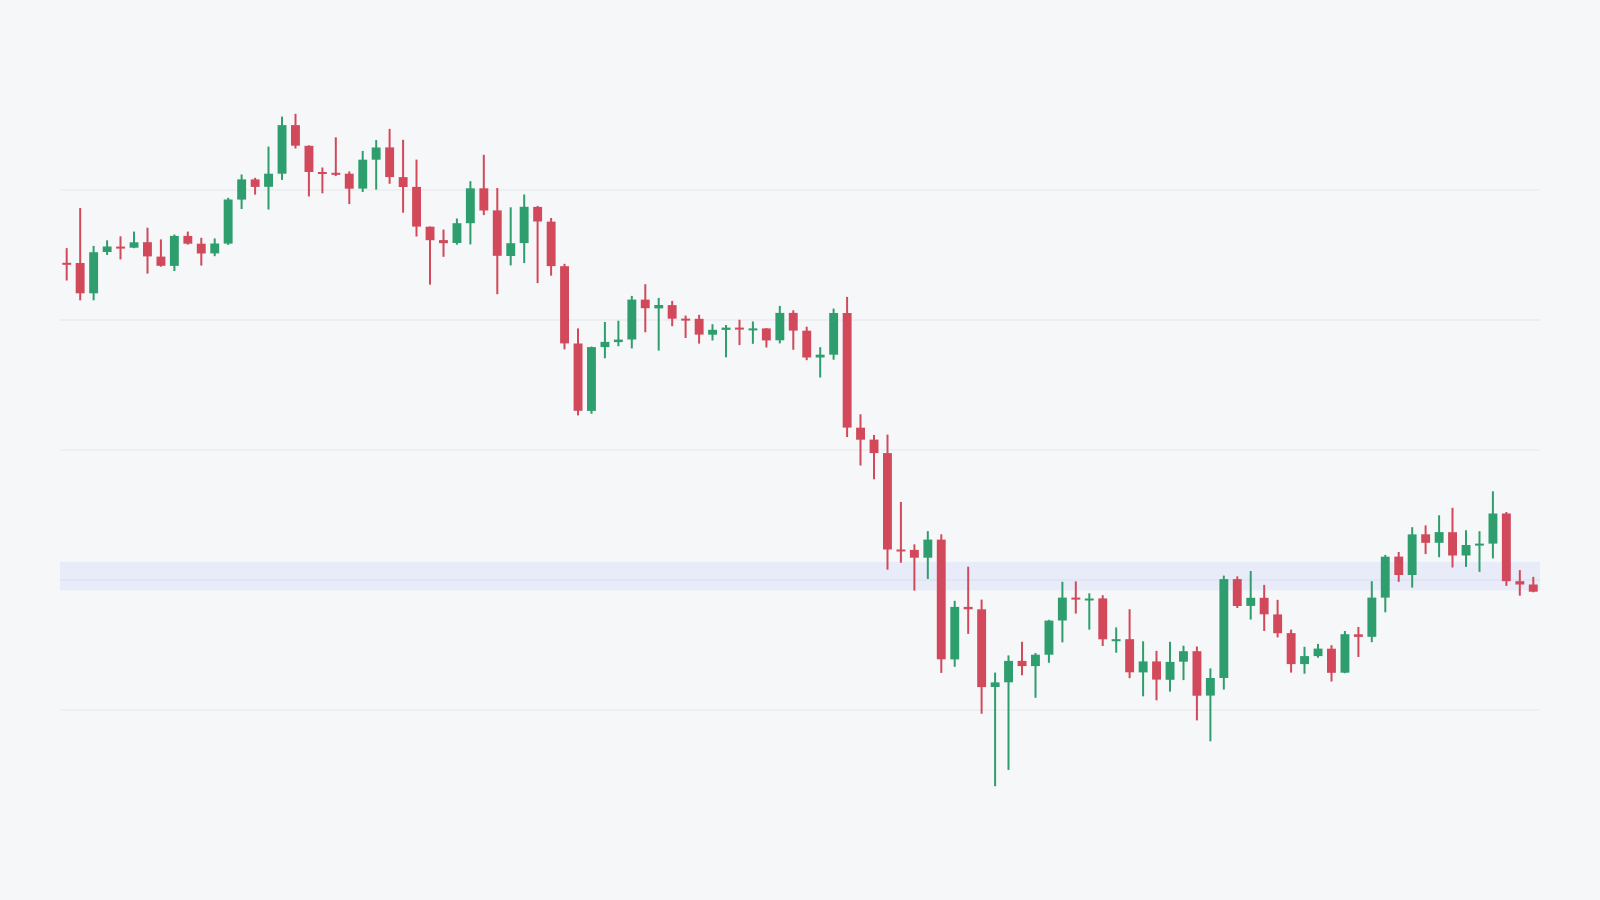
Where should I place my stop loss? A price action guide
Choose an exit rule before sizing a trade. A fixed stop and a candle-close invalidation are different; a real SOL timeline shows why fills matter.
-
How much should a beginner risk per trade? Risk management basics
Learn planned risk, R and drawdown with hypothetical examples. A 1% rule is a chosen budget, not a safety threshold or guaranteed stop-loss limit.